
Bitcoin Rally Sends Fear to Greed in 24 Hours
Bitcoin gained about 20% in a week as Treasury buybacks triggered short liquidations and pushed crypto sentiment from fear to greed.


Bitcoin has delivered one of its strongest weekly performances in more than two years, climbing roughly 20% in seven days and recovering above the $75,000 level after spending much of the previous two weeks below $65,000. The move marked Bitcoin’s best week since March 2024 and helped lift the total cryptocurrency market capitalization above $2.5 trillion.
What made the rally unusual was not only its speed but also the dramatic change in market psychology. The Bitcoin Fear and Greed Index moved from fear to greed in approximately 24 hours, showing how quickly traders can reposition when a major market catalyst changes expectations. The shift followed an unexpected announcement involving larger U.S. Treasury buybacks, which caused bond yields to fall temporarily and forced heavily shorted Bitcoin positions to close.
The resulting short squeeze, combined with renewed spot demand, positive Bitcoin ETF flows and continued buying from large holders, created a powerful feedback loop. Rising prices forced bearish traders to cover positions, while momentum traders entered the market to avoid missing the next move.
Yet the rally has also raised important questions. Is Bitcoin beginning a durable recovery, or did leverage and forced liquidations exaggerate a short-term bounce? Are institutional investors returning with conviction, or are traders simply responding to a temporary liquidity signal? And can Bitcoin maintain its gains if funding rates remain elevated and sentiment becomes overheated?
Understanding what happened requires looking beyond the headline price. The rally involved monetary expectations, derivatives positioning, institutional demand, whale accumulation and investor psychology. Together, these factors explain why Bitcoin moved so sharply—and why the next phase could remain highly volatile.
Bitcoin’s best weekly performance since 2024
Bitcoin’s latest advance stands out because of the distance it covered in a short period. The asset traded below $65,000 for much of the previous fortnight before accelerating to more than $75,000 during Asian trading hours on Friday. A move of approximately 20% in seven days is significant even by Bitcoin’s historical standards, particularly after a period of weakness and uncertainty.
The rebound also helped pull the broader crypto market higher. Ethereum advanced alongside Bitcoin, while the combined market value of digital assets returned above $2.5 trillion. When Bitcoin rises this quickly, its effect often spreads through the market because Bitcoin remains the largest cryptocurrency by market capitalization and a major source of liquidity for the entire sector.
Why the price move was so powerful
The rally was not driven by a single type of buyer. Instead, several market forces reinforced one another. Initial buying lifted Bitcoin through important technical levels. That rise placed pressure on traders who had bet on lower prices. As short positions were liquidated, exchanges automatically closed those trades by buying Bitcoin, creating additional upward momentum.
This process can turn an ordinary rally into a rapid advance. A trader holding a leveraged short position may be forced to purchase Bitcoin when the market moves against them. If many traders are positioned similarly, those forced purchases can arrive simultaneously and produce a sharp liquidation cascade.
The rally therefore reflected both genuine demand and mechanical buying. That distinction matters because forced buying can push prices higher quickly but may not always provide the same long-term support as sustained spot accumulation.
Bitcoin’s recovery followed a period of weakness
The strength of the move becomes clearer when viewed against the prior market backdrop. Bitcoin had spent weeks under pressure as investors assessed interest rates, bond-market conditions and the direction of institutional flows. Many traders had reduced risk or opened short positions, expecting tighter financial conditions to limit demand for volatile assets.
That defensive positioning created fuel for a reversal. When the market received a more supportive policy signal, traders were forced to reassess their assumptions almost immediately. The result was a rapid transition from caution to aggressive buying.
The Treasury buyback announcement that triggered the reversal
The immediate catalyst was an announcement from Treasury Secretary Scott Bessent concerning the U.S. Treasury’s long-duration bond buyback program. The department doubled the size of its planned buybacks from $2 billion to at least $4 billion per operation. The updated program is scheduled to begin on September 9 and continue through November 4.
No Treasury cash had moved at the time of the announcement. That detail is important because the initial market reaction was based primarily on expectations and signaling rather than the immediate injection of funds into financial markets.
The announcement nevertheless had a rapid effect on long-term bond yields. Yields had climbed toward levels not seen in almost two decades after months of weak demand for 30-year U.S. debt. The prospect of greater Treasury support caused yields to fall sharply at first as traders interpreted the decision as a sign that officials were prepared to stabilize a strained part of the bond market.
Why bond-market news affected Bitcoin
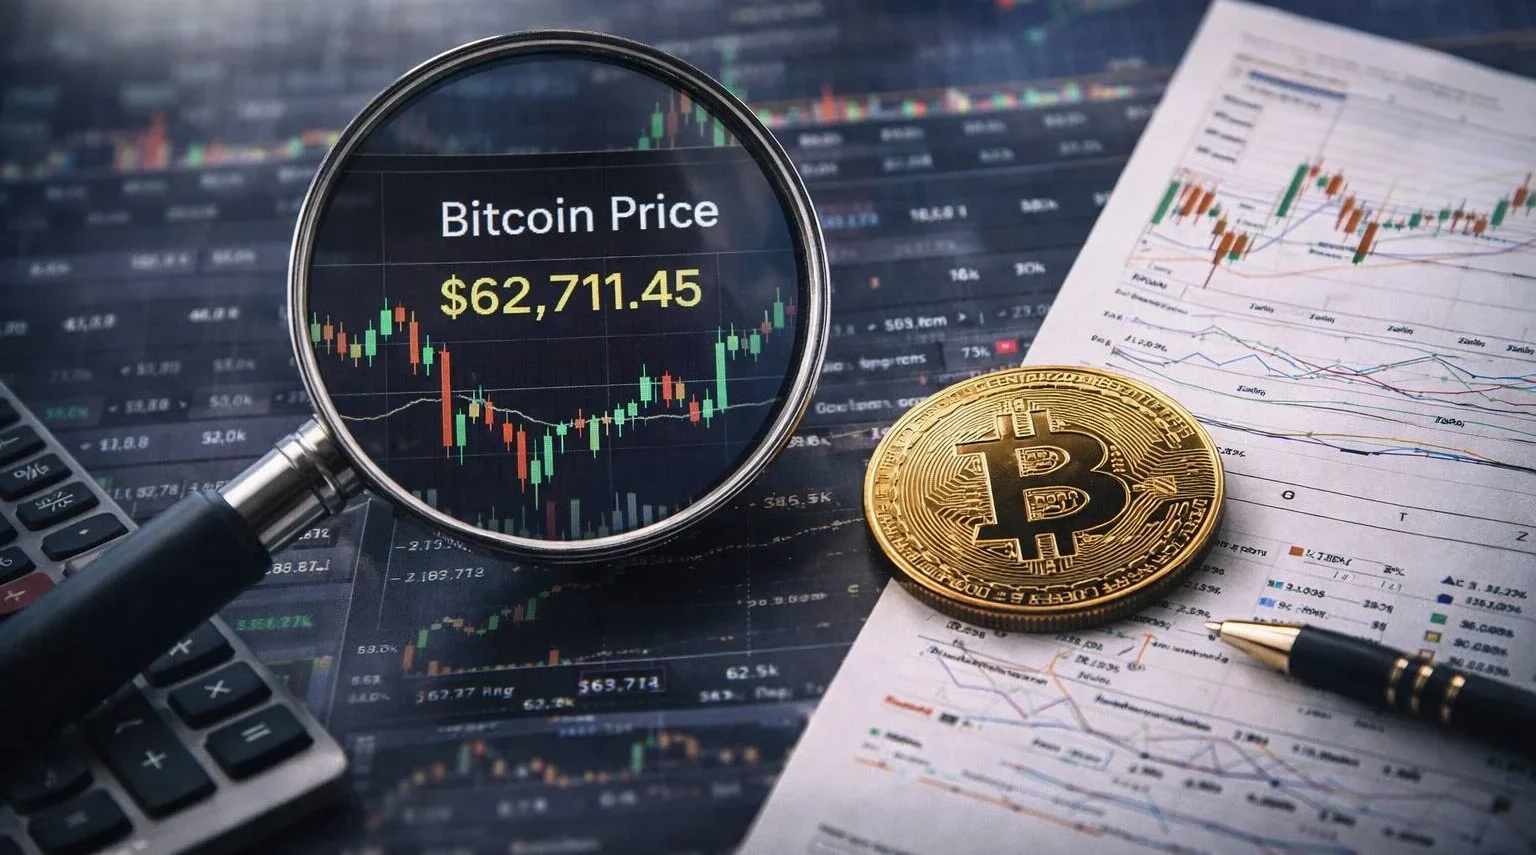
Bitcoin increasingly trades as part of the broader global risk market. Although its monetary design is separate from government debt markets, its price is influenced by liquidity conditions, interest-rate expectations and investor risk appetite.
When bond yields rise sharply, investors may prefer safer income-generating assets over speculative investments such as cryptocurrencies. Higher yields can also tighten financial conditions by increasing borrowing costs and reducing the appeal of riskier positions.
A decline in yields, or even the expectation that policymakers may respond to market stress, can have the opposite effect. Traders may begin to anticipate improved liquidity and greater willingness to own assets with higher potential returns. That does not mean a Treasury buyback directly creates Bitcoin demand. Rather, the announcement changed the market’s perception of financial conditions, and Bitcoin responded as a highly liquid risk asset.
A signaling event rather than an immediate liquidity event
The Treasury action demonstrates how strongly financial markets can react to policy communication. Because the buybacks had not yet taken effect, Bitcoin’s reaction was largely based on interpretation. Traders treated the announcement as evidence that officials were paying closer attention to bond-market weakness and might be willing to provide additional support if necessary.
That interpretation helped shift sentiment before the policy had any direct mechanical effect. Bessent added to the optimism the following day by indicating that the eventual buyback total could exceed $4 billion.
The episode shows that Bitcoin does not always need a direct cryptocurrency-specific announcement to move sharply. Broader financial signals can be enough to change positioning across digital assets.
How short liquidations accelerated the Bitcoin rally
Approximately $3 billion in short positions were liquidated during the day following the Treasury announcement. Those liquidations became one of the most important forces behind Bitcoin’s rapid move.
A short position profits when an asset declines. When Bitcoin rises instead, a short seller may need to buy the asset to close the trade. In leveraged markets, the exchange can force that closure automatically once the trader’s collateral is no longer sufficient. This forced buying adds demand at precisely the moment prices are already rising.
The mechanics of a short squeeze
A typical short squeeze develops in several stages. First, traders accumulate bearish positions because they expect the market to fall. Next, an unexpected catalyst causes the price to move higher. Some short sellers close their trades voluntarily, while others are liquidated by exchanges.
Those buy orders push the price even higher. The next group of short sellers then faces greater losses and begins covering positions. This creates a chain reaction in which bearish positioning becomes fuel for the rally.
The Bitcoin market is particularly vulnerable to this pattern because derivatives exchanges offer substantial leverage. Perpetual futures allow traders to maintain positions without an expiration date, but they also require regular funding payments and can be liquidated quickly when prices move sharply.
Why liquidation-driven rallies require caution
Liquidations can explain the speed of the move, but they do not necessarily prove that Bitcoin has entered a new long-term uptrend. Once the forced buying ends, the market must attract fresh demand from spot buyers and longer-term investors.
If new buyers continue entering the market, a liquidation-driven rally can evolve into a sustainable recovery. If demand fades, prices may consolidate or retrace as short-term traders take profits.
For that reason, traders often compare spot volume, futures open interest and exchange inflows when evaluating the quality of a Bitcoin rally. A rise supported mainly by spot purchases is generally viewed as healthier than one led primarily by leveraged derivatives activity.
Bitcoin sentiment moved from fear to greed in one day
The sharpest psychological development was the sudden reversal in the Fear and Greed Index. The index rose from 46, a level associated with fear, to 62 in one day. It then reached 72 by Friday, placing market sentiment firmly in greed territory.
The index combines several market indicators, including volatility, momentum, trading volume, social media activity, Bitcoin dominance and search trends. It is designed to show how investors are behaving rather than to predict prices with certainty.
What a move from fear to greed means
A rapid shift from fear to greed generally indicates that traders have become much more willing to take risk. Investors who had been waiting for confirmation may enter the market after a breakout, while existing holders may become less likely to sell.
Greed can help sustain upward momentum because it encourages participation. However, it can also create vulnerability. When traders become convinced that prices can only rise, they may use excessive leverage or chase late-stage gains. That behavior can make the market fragile if the next catalyst is negative.
The speed of the sentiment reversal is therefore both bullish and cautionary. It confirms that buyers have regained confidence, but it also suggests that expectations may have moved faster than underlying fundamentals.
Sentiment is a measure, not a trading signal
The Fear and Greed Index should not be treated as a standalone buy or sell indicator. Extreme fear can occur during a market bottom, but it can also appear during the early stages of a deeper decline. Likewise, greed may accompany a powerful breakout or signal that short-term enthusiasm has become excessive.
The most useful approach is to combine sentiment data with price structure, liquidity, on-chain metrics, ETF flows and derivatives positioning. Sentiment explains the emotional environment; it does not determine the next candle.
Evidence supporting a lasting Bitcoin recovery
Several factors suggest that the rally could represent more than a temporary reaction to short covering. Large Bitcoin holders reportedly added billions of dollars worth of BTC over the previous two months, including during the market drawdown. If accurate, that pattern indicates that some long-term investors were accumulating while short-term sentiment remained weak.
Spot and futures demand also turned positive on a 30-day basis for the first time in several months, according to data cited from CryptoQuant. A positive shift across both markets suggests that demand may be broadening rather than remaining concentrated in a single group of traders.
Renewed institutional and ETF demand
Spot Bitcoin exchange-traded funds have also shown signs of improvement. ETF flows reportedly turned positive again in July and early August after a weaker first half of the year.
ETF flows are important because they provide a regulated investment route for institutions, advisers and other market participants that may not want to manage cryptocurrency wallets or trade directly on crypto exchanges. Persistent inflows can create steady spot demand, particularly when funds need to purchase Bitcoin to back new shares.
However, daily ETF figures can fluctuate considerably. One strong week does not establish a permanent trend. Investors should pay attention to whether inflows continue across several weeks and whether they are accompanied by healthy spot-market activity.
Whale accumulation and exchange balances
Large-holder behavior is another closely watched indicator. When whales accumulate Bitcoin and move coins away from exchanges, available supply may decline. If demand rises at the same time, that tightening can support prices.
Exchange balances must be interpreted carefully, however. Coins can move for many reasons, including custody changes, internal transfers and institutional settlement. On-chain data is valuable, but it works best when combined with market data rather than used in isolation.
Risks that could undermine the rally
The strongest argument against assuming a new bull market is the speed of the sentiment reversal. Bitcoin moved from fear to greed in roughly one day, and such abrupt transitions can unwind quickly if traders discover that the original catalyst was less powerful than expected.
The Treasury buyback program does not begin until September 9, and its structural effect on bond-market liquidity remains uncertain. Long-term yields also recovered some of their initial decline, suggesting that investors were not uniformly convinced that the program would solve underlying demand problems.
Elevated funding rates
Bitcoin funding rates reached a 20-month high during the rally. Funding rates represent the periodic payments exchanged between traders in perpetual futures markets. When rates become strongly positive, long-position holders pay shorts because demand for leveraged bullish exposure is high.
Elevated funding can confirm strong optimism, but it can also signal that too many traders are positioned in the same direction. If Bitcoin stalls or declines, overleveraged longs may be liquidated, creating downward pressure.
This is the mirror image of the short squeeze that drove the initial rally. Instead of bearish positions fueling gains, crowded bullish positions can amplify a correction.
The possibility of a delayed cycle bottom
Some analysts continue to argue that Bitcoin’s broader market cycle may not have completed its downside phase. Benjamin Cowen, for example, has suggested that a cycle bottom could still be more than two months away.
Such projections are inherently uncertain. Bitcoin cycles do not follow an exact timetable, and historical patterns can be disrupted by ETF adoption, changing monetary policy and institutional participation. Still, the possibility of another market low is a reminder that a strong weekly gain does not eliminate macroeconomic risk.
Macro conditions remain decisive
Bitcoin remains sensitive to inflation data, central-bank policy, employment figures, bond yields and movements in the U.S. dollar. A renewed rise in yields or a sudden reduction in global liquidity could pressure cryptocurrencies even if the current technical structure looks constructive.
Regulatory developments, geopolitical shocks and large-holder selling are additional risks. Traders should also remember that cryptocurrency markets operate around the clock, meaning major moves can occur outside traditional U.S. trading hours.
What traders should watch next
The next stage of Bitcoin’s move will depend on whether spot demand can replace the buying created by short liquidations. Sustained demand would make it easier for Bitcoin to hold its breakout and establish new support levels. Weakening volume, rising open interest and increasingly aggressive leverage would present a less comfortable picture.
Price stability above former resistance
Holding above the levels that previously acted as resistance would strengthen the bullish case. A market that breaks higher and then successfully retests the breakout zone often shows that sellers have been absorbed and buyers are willing to defend the new range.
A sharp rejection, by contrast, could indicate that the rally was primarily a liquidity event. Traders may then watch whether Bitcoin returns to its previous range or finds support at a higher level.
ETF flows and spot-market demand
ETF inflows should remain a central focus. Consistent inflows would suggest that institutional demand is participating in the recovery. Outflows during a price advance could imply that retail or derivatives traders are driving the move instead.
Spot exchange volume is equally important. Healthy participation from unleveraged buyers can help reduce dependence on liquidation activity and leverage.
Funding rates and open interest
Funding rates should ideally cool from extreme levels while Bitcoin remains stable or continues rising. That pattern would suggest that the market is becoming less dependent on speculative leverage.
If open interest rises sharply alongside funding rates and price begins to stall, the risk of a long squeeze increases. Traders may also monitor liquidation heat maps and basis spreads to determine whether derivatives positioning has become unbalanced.
Bitcoin dominance and altcoin performance
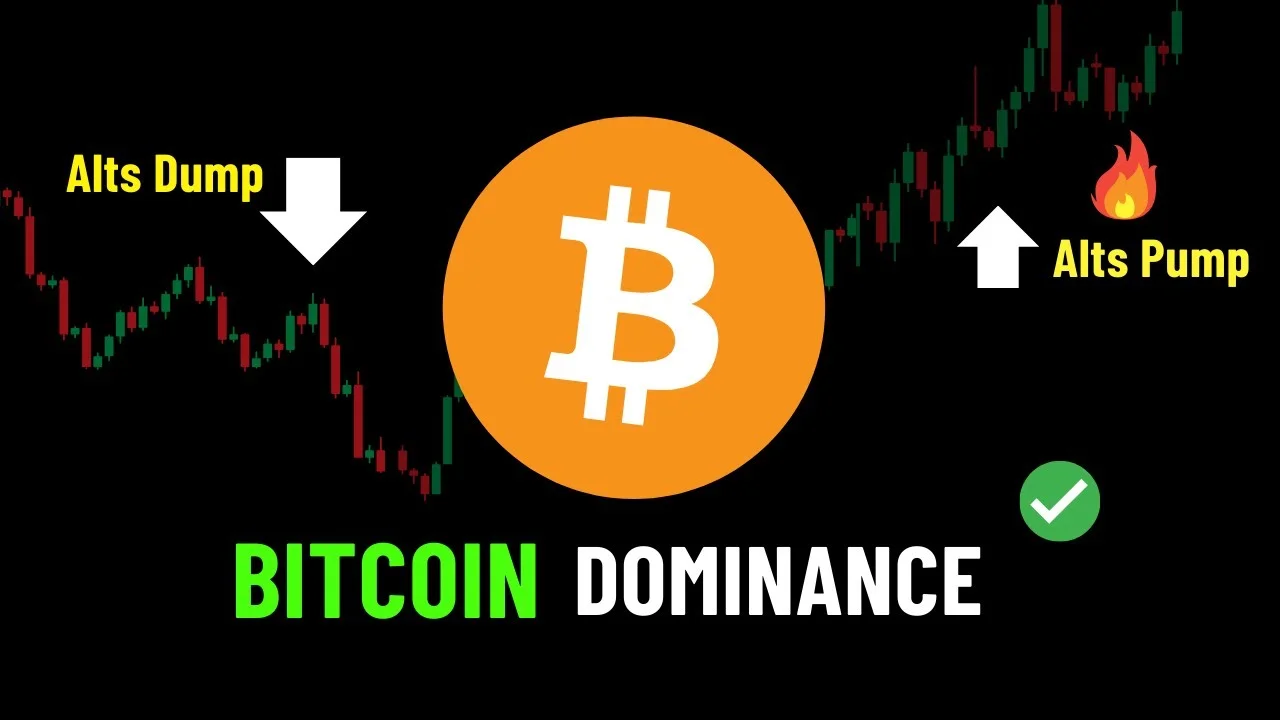
Bitcoin’s dominance can provide clues about how capital is moving within the cryptocurrency market. If Bitcoin rises while dominance increases, investors may be seeking relative safety within crypto. If altcoins begin outperforming dramatically, risk appetite may be expanding into more speculative assets.
Neither outcome is automatically bullish or bearish. A measured rotation can support a healthy market, while an explosive altcoin rally may signal late-stage speculation.
What the rally means for Bitcoin’s broader outlook
Bitcoin’s best week since 2024 has clearly improved the market’s tone. The rally demonstrated that investors remain highly responsive to liquidity expectations and that bearish positioning can reverse quickly when a surprise policy signal arrives.
The combination of large-holder accumulation, improving ETF flows and stronger spot demand provides a constructive foundation. At the same time, high funding rates, rapid sentiment expansion and uncertainty around the Treasury program mean that volatility is likely to remain elevated.
The most reasonable interpretation is that Bitcoin has entered an important recovery phase, not that the market has received definitive proof of a new all-time-high cycle. Confirmation will require sustained demand, stable price action and evidence that leverage is cooling rather than building uncontrollably.
Conclusion
Bitcoin’s roughly 20% weekly gain marked its strongest performance since March 2024 and pushed the cryptocurrency above $75,000 after weeks of weakness. The rally was triggered by a surprise increase in planned Treasury bond buybacks, which changed expectations around liquidity and financial-market support.
A subsequent short squeeze amplified the move, with approximately $3 billion in bearish positions liquidated. At the same time, the Bitcoin Fear and Greed Index jumped from 46 to 62 in a day before reaching 72, illustrating the extraordinary speed of the shift from fear to greed.
The recovery has credible supporting evidence, including whale accumulation, improving ETF flows and stronger 30-day demand. But elevated funding rates and the possibility of another cycle low mean traders should not confuse a powerful rebound with guaranteed continuation.
Bitcoin’s next direction will depend on whether fresh spot demand can sustain the rally after forced liquidations fade. For now, the market has regained momentum—but it has also entered a zone where discipline matters more than excitement.
FAQs
Q1. Why did Bitcoin rise so sharply this week?
Bitcoin rose after a surprise Treasury announcement increased the planned size of long-duration bond buybacks. The announcement improved market expectations around financial liquidity and pushed bond yields lower initially.
Q2. What does the Bitcoin Fear and Greed Index measure?
The Bitcoin Fear and Greed Index measures market psychology using factors such as price momentum, volatility, trading volume, social-media activity, Bitcoin dominance and search interest.
Q3. Does a move from fear to greed mean Bitcoin will keep rising?
Not necessarily. A rapid shift to greed can support momentum, but it may also show that traders have become overconfident. If leverage and funding rates become too high, a modest price decline can trigger a long squeeze.
4. How do short liquidations affect Bitcoin’s price?
When a trader shorts Bitcoin, they profit from a decline. If the price rises instead, the trader may need to buy BTC to close the position. Leveraged traders can be liquidated automatically, forcing additional purchases.
Q5. What should investors watch after Bitcoin’s rally?
Investors should monitor whether Bitcoin can hold its breakout levels, whether spot-market volume remains strong and whether Bitcoin ETF inflows continue.